I want you to take a good look at this picture…
Ok did you do it? Did you take a good look at this picture?
You may have seen this picture on the subway map.
Or you could read about it in a math textbook.
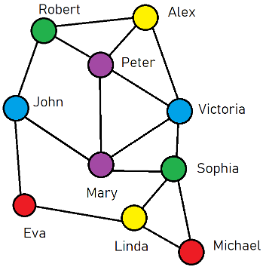
What it shows is a group of people, each one of them has two friends or more
For example, Eva and Michael, Victoria and John, Mary and Peter…
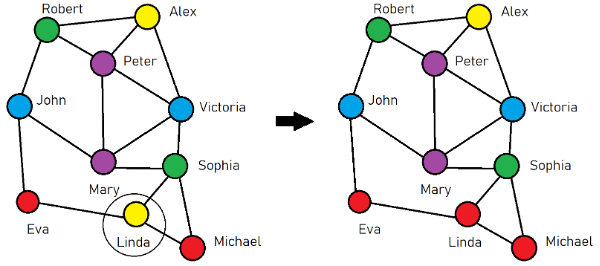
So, when Linda saw her friends Eva and Michael wearing the same Red T-shirt, she got jealous.
The next day…
Linda changes the color of her T-shirt to red (look at the picture)
What if before that Victoria saw Peter and Mary wearing a new purple fashion T-shirt? And she liked it…
Alex bought it because he wanted to surprise his wife at her birthday party since her favorite color is purple.
Over time something happens…
Purple T-shirts became popular
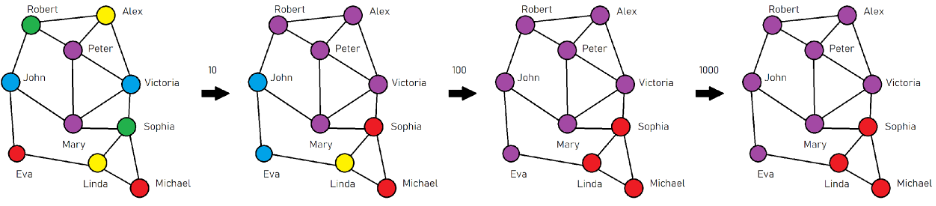
Pay close attention here, there are two things you can get from this picture.
The first thing is T-shirt colors stop changing over time.

| Private Lessons | | | Group Lessons |
The second thing is two large groups of people with the same T-shirt color one of them PURPLE the other RED
This is what we call Entropy increases.
It is irreversible changes in physical systems…
It’s more like mixing coffee and milk…
So, if you are interested in discovering the mathematics behind this…
You can learn all of these and many other theories from best teachers in field.
Sign up NOW for a free trial lesson:
Click here: Tutors who teach Graph and Set Theory.
P.S. - I know that you like this type of article that’s why…
We have more fascinating articles like this to read, click the button below:
| Private Lessons | | | Group Lessons |


